Today, we will learn how to create custom CloudWatch metrics like RAM Usage and Disk Usage in centos 7?
What made me do this and why it is important?
Let’s see monitoring is a very important part of maintaining our servers. Also, AWS didn’t support these monitoring scripts for Centos. This made it difficult for a system administrator to monitor the environment.
Monitor RAM and Disk Usage in CentOS 7
A little bit about a script:
Script Name: mon-put-instance-data.pl
Purpose: This script is written in pearl and is used to collect metrics of swap, disk, and memory. In this blog, we will create custom CloudWatch metrics for RAM and disk.
Well, you are at the right place, because I’m going to show you how it’s done.
Prerequisite:
- Centos 7
- AWS IAM role with EC2 and CloudWatch access. You need to attach the role to your centos instance.
Creating custom CloudWatch Metrics (Centos 7)
-
- Install the following packages:
sudo yum install perl-Switch perl-DateTime perl-Sys-Syslogperl-LWP-Protocol-https perl-Digest-SHA perl-LWP-Protocol-https -y
- We also need zip and unzip tools:
sudo yum install zip unzip -y
- Download the monitoring scripts:
curl http://aws-cloudwatch.s3.amazonaws.com/downloads/CloudWatchMonitoringScripts-1.2.1.zip -O
- Run the below commands to install the script:
unzip CloudWatchMonitoringScripts-1.2.1.zip
rm CloudWatchMonitoringScripts-1.2.1.zip
cd aws-scripts-mon
- To verify the scripts are working enter this command:
./mon-put-instance-data.pl --mem-util --verify --verbose
- Now, let make this command automated by running it in crontab:
crontab -e
- Enter these cronjob commands to send RAM and Disk Usage to AWS CloudWatch:
Note: Instead of “/home/centos” enter your directory where you have installed the script. In the disk-path enter the mounted path of the volume whose metrics you want. In this case, I want metrics of the root EBS volume.*/5 * * * * /home/centos/aws-scripts-mon/mon-put-instance-data.pl --mem-used --mem-util --mem-avail */5 * * * * /home/centos/aws-scripts-mon/mon-put-instance-data.pl --disk-path=/ --disk-space-util --disk-space-avail --disk-space-used
- Go to CloudWatch console and Create a new dashboard.
- Click on Add widget option and then select Linux system Metrics.
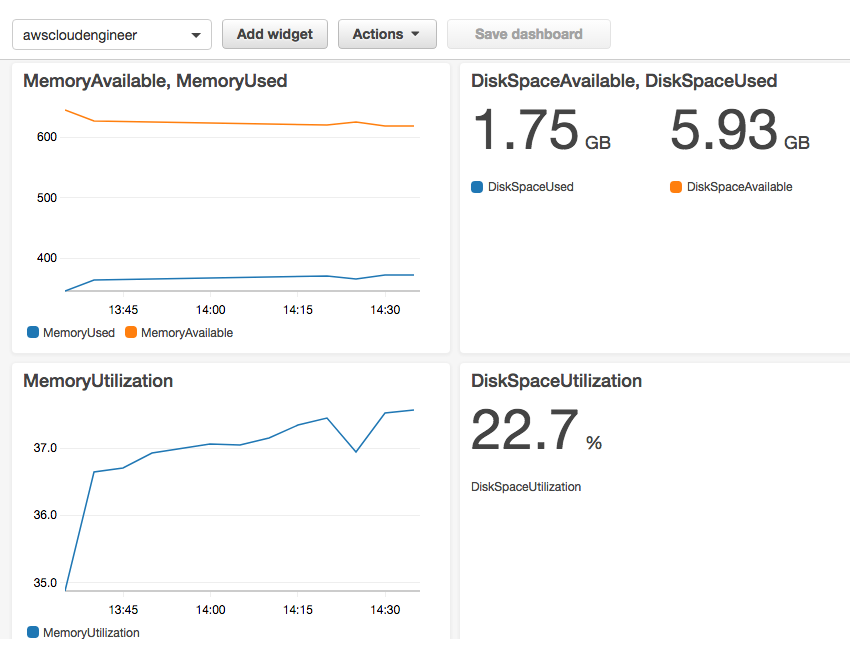
Here you have it the screenshot of custom CloudWatch metrics:

Custom CloudWatch Metrics Feel free to comment and contact me for more blogs.
Reference: AWS Monitoring, Blog by AWS
- Install the following packages:


Very helpful 👍🏼👍🏼👍🏼👍🏼👍🏼👍🏼
I’m glad you liked it. Let me know if you need to learn something else in AWS.
Really good post It would help to monitor memory and disk metrics which AWS didn’t provide by default…..
Awaiting same another post….which will make easier sys admin work….
Nice post!!!
I’m glad you liked it.
You should probably also mention that there are other ways to accomplish this:
a) You can use the AWS CLI and simply call “aws cloudwatch put-metric-data” from a script with whatever you want to publish to a custom metric.
b) You can use https://collectd.org/ – with the CloudWatch plugin (https://aws.amazon.com/blogs/aws/new-cloudwatch-plugin-for-collectd/).
Hello Max,
These are also great alternatives. As you have mentioned them in the comment I don’t think I need to add them to the blog. BTW AWStats is a great tool too.
You are great man!!! This saved my life!!!
u r my hero
Mate. i expected failure and have been poorly mistaken. you have done a nice job.
some notes:
im running centos 7 and by doing a bit more searching found it also necessary to add the user secure key and ID number. find the file “awscreds.template” copy it and rename it to “awscreds.conf”. edit that document and add in the user ID and secure Key.
you must create a new user in AWS IAM. – note the secure key show once and can not be seen again. it shows at the end of making a user and giving that user admin rights. you can make a group or just give that user admin rights.
and then you also need to get the tool – yum install perl-LWP-Protocol-https
it does not work without it.
then you can test it working and uploading with – ./mon-put-instance-data.pl –mem-util –mem-used-incl-cache-buff –mem-used –mem-avail
Thanks for your suggestions muppet!!! I have updated my blog.
great how-to, thanks (from a Linux beginner) – for me it didn’t work though until I installed this:
sudo yum install perl-LWP-Protocol-httpsOnly then did the Linux System metrics showed up in CW dashboard
I discovered this by running the script manually like:
./mon-put-instance-data.pl --disk-path=/ --disk-space-util --disk-space-avail --disk-space-usedWhich gave the following error:
ERROR: Failed to call CloudWatch: HTTP 501. Message: LWP will support https URLs if the LWP::Protocol::https module
is installed.
Thanks for your suggestion, I have already updated the blog.